Australia’s love affair with debt
February 20th 2018

Key Points
- Household debt levels in Australia are high compared to other countries and still rising.
- The rise is not as bad as it looks as it’s been matched by rising wealth.
- Debt servicing problems are low. However, this could change as interest rates rise and if home prices fall sharply.
- The trigger for major problems remains hard to see but it’s worth keeping an eye on.
- High debt levels will mean the RBA won’t need to raise rates as much as in the past to control any inflation problem that may arise.
Introduction
If Australia has an Achille’s heel it’s the high and still rising level of household debt that has gone hand in hand with the surge in house prices relative to incomes. Whereas several comparable countries have seen their household debt-to-income ratios pull back a bit since the Global Financial Crisis (GFC), this has not been the case in Australia. Some worry Australians are unsustainably stretched, and it is only a matter of time before it blows up, bringing the economy down at the same time. Particularly now that global interest rates are starting to rise. This note looks at the main issues.
Australia – from the bottom to the top in debt stakes
The chart below shows the level of household debt (mortgage, credit card and personal debt) relative to annual household disposable income for major countries.
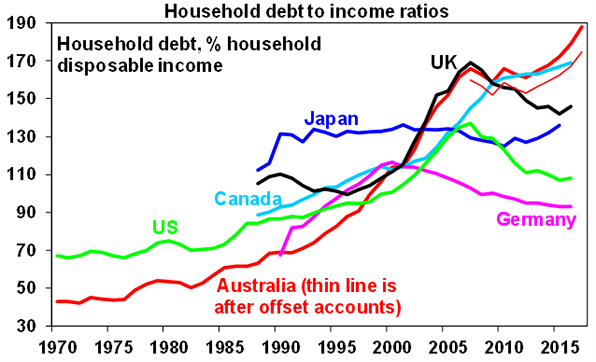
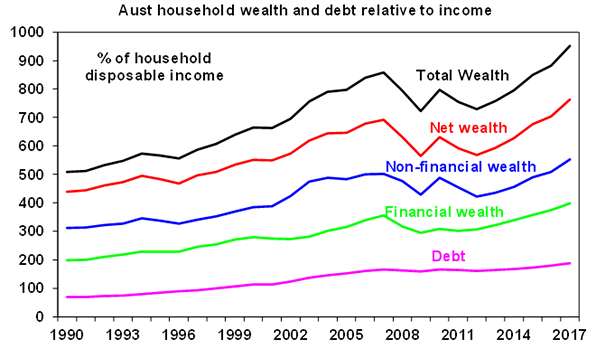
While rising household debt has been a global phenomenon, debt levels in Australia have gone from the bottom of the pack to near the top. In 1990, there was on average $70 of household debt for every $100 of average household income after tax. Today, it is nearly $200 of debt (not allowing for offset accounts) for every $100 of after-tax income.
Why has debt gone up so much in Australia?
The increase in debt reflects both economic and attitudinal changes. Memories of wars and economic depression have faded and with the last recession ending nearly 27 years ago, debt seems less risky. Furthermore, modern society encourages instant gratification as opposed to saving for what you want. Lower interest rates have made debt seem more affordable and increased competition amongst financial providers has made it more available. So, each successive generation since the Baby Boomers through to Millennials has been progressively more relaxed about taking on debt than earlier generations.
It’s not quite as bad as it looks
There are several reasons why the rise in household debt may not be quite as bad as it looks:
Firstly, higher debt partly reflects a rational adjustment to lower rates and greater credit availability via competition.
Secondly, household debt has been rising since credit was first invented. It is unclear what a “safe” level is. This is complicated because income is a flow and debt is a stock that is arguably best measured against the stock of assets or wealth. And on this front, the rise in the stock of debt levels has been matched by a rise in total household wealth in Australia. Thanks to a surge in the value of houses and a rise in financial wealth, we are far richer. Wealth rose 9.5% last year to a new record. The value of average household wealth has gone from five times the average annual after-tax household income in 1990 to 9.5 times today.
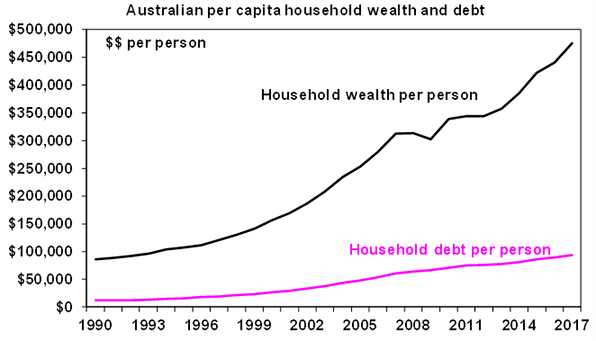
So, while the average level of household debt for each man, woman, and child in Australia has increased from $11,837 in 1990 to $93,943 now, this has been swamped by an increase in average wealth per person from $86,376 to $475,569.
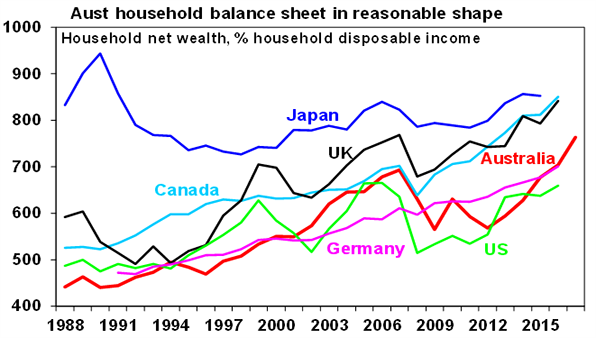
As a result, Australians’ household balance sheets, as measured by net wealth (assets less debt), are healthy. Despite a fall in net wealth relative to income through and after the GFC as shares and home prices fell, net wealth has increased substantially over the last 30 years and is in the middle of the pack relative to comparable countries.
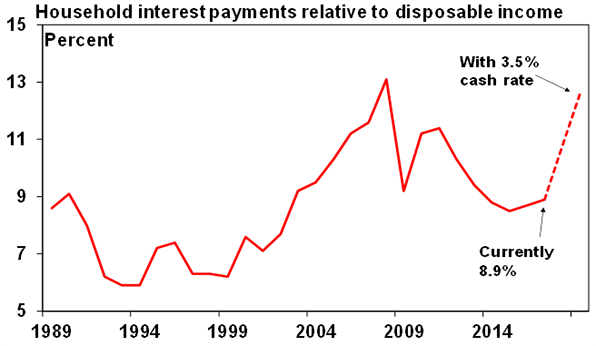
In addition, currently, Australians are also not having major problems servicing their loans. According to the Reserve Bank’s Financial Stability Review, non-performing loans are low and Census and Household Expenditure Survey data show that mortgage stress has been falling. Of course, this may reflect low mortgage rates with interest costs as a share of income running a third below its 2008 high.
Next, debt is mostly concentrated in higher-income households that often have a higher capacity to service it. This is particularly the case for investment property loans. A disproportionate share of the rise in housing debt over the last 20 years owes to investment property loans. As servicing investment loans is helped by tax breaks the debt burden is not even as onerous.
Finally, lending standards have not deteriorated to the same degree in Australia as they did in the US prior to the GFC where loans were given to NINJAs – borrowers with no income, no job and no assets.
So what are the risks?
None of this is to say the rise in household debt is without risk. Not only has household debt relative to income in Australia risen to the top end of comparable countries but so too has the level of gearing (i.e. the ratio of debt to wealth or assets). It certainly increases households’ vulnerability to changing economic conditions.
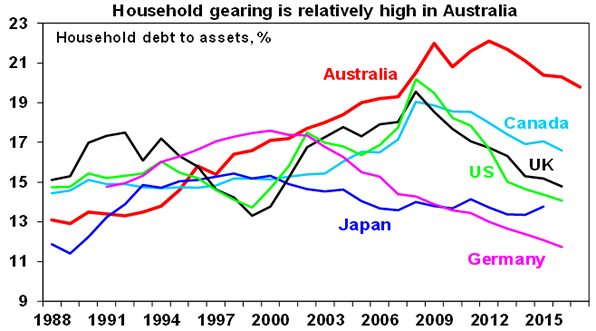
There are several threats:
- Higher interest rates – the rise in debt means moves in interest rates are three times as potent compared to say 25 years ago. Just a 2% rise in interest rates will take interest payments as a share of household income back to where they were just prior to the GFC (and which led to a fall in consumer spending). However, the RBA is well aware of the rise in sensitivities flowing from higher debt and so knows that when the time comes to eventually start raising rates (maybe later this year) it simply won’t have to raise rates anywhere near as much as in the past to have a given impact on say controlling spending and inflation. And so, it’s likely to be very cautious in raising rates (and is very unlikely to need to raise rates by anything like 2%.)
- Rising unemployment – high debt levels add to the risk that if the economy falls into recession, rising unemployment will create debt-servicing problems. However, it is hard to see unemployment rising sharply anytime soon.
- Deflation – high debt levels could become a problem if the global and local economies slip into deflation. Falling prices increase the real value of debt, which could cause debtors to cut back spending and sell assets, risking a vicious spiral. However, the risk of deflation has been receding.
- A sharp collapse in home prices – by undermining the collateral for much household debt – could cause severe damage. Fortunately, it is hard to see the trigger for a major collapse in house prices, ie, much higher interest rates or unemployment. And full recourse loans provide a disincentive to just walk away from the home and mortgage unlike in parts of the US during the GFC.
- A change in attitudes against debt – households could take fright at their high debt levels (maybe after a bout of weakness in home prices or when rates start to rise) and seek to cut them by cutting their spending. Of course, if lots of people do this at the same time it will just result in slower economic growth. At present the risk is low but its worth keeping an eye on with Sydney and Melbourne property prices now falling. But high household debt levels are likely to be a constraint on consumer spending.
Conclusion
While the surge in household debt has left Australian households vulnerable to anything which threatens their ability to service their debts or significantly undermines the value of houses, the trigger for major problems remains hard to see. However, household discomfort at their high debt levels poses a degree of uncertainty over the outlook for consumer spending should households decide to reduce their debt levels.
Please contact us if you would like to discuss more or if you would like to review your finance options.
[ninja_form id=41]
Important note: While every care has been taken in the preparation of this article, AMP Capital Investors Limited (ABN 59 001 777 591, AFSL 232497) and AMP Capital Funds Management Limited (ABN 15 159 557 721, AFSL 426455) makes no representations or warranties as to the accuracy or completeness of any statement in it including, without limitation, any forecasts. Past performance is not a reliable indicator of future performance. This article has been prepared for the purpose of providing general information, without taking account of any particular investor’s objectives, financial situation or needs. An investor should, before making any investment decisions, consider the appropriateness of the information in this article, and seek professional advice, having regard to the investor’s objectives, financial situation and needs. This article is solely for the use of the party to whom it is provided.
